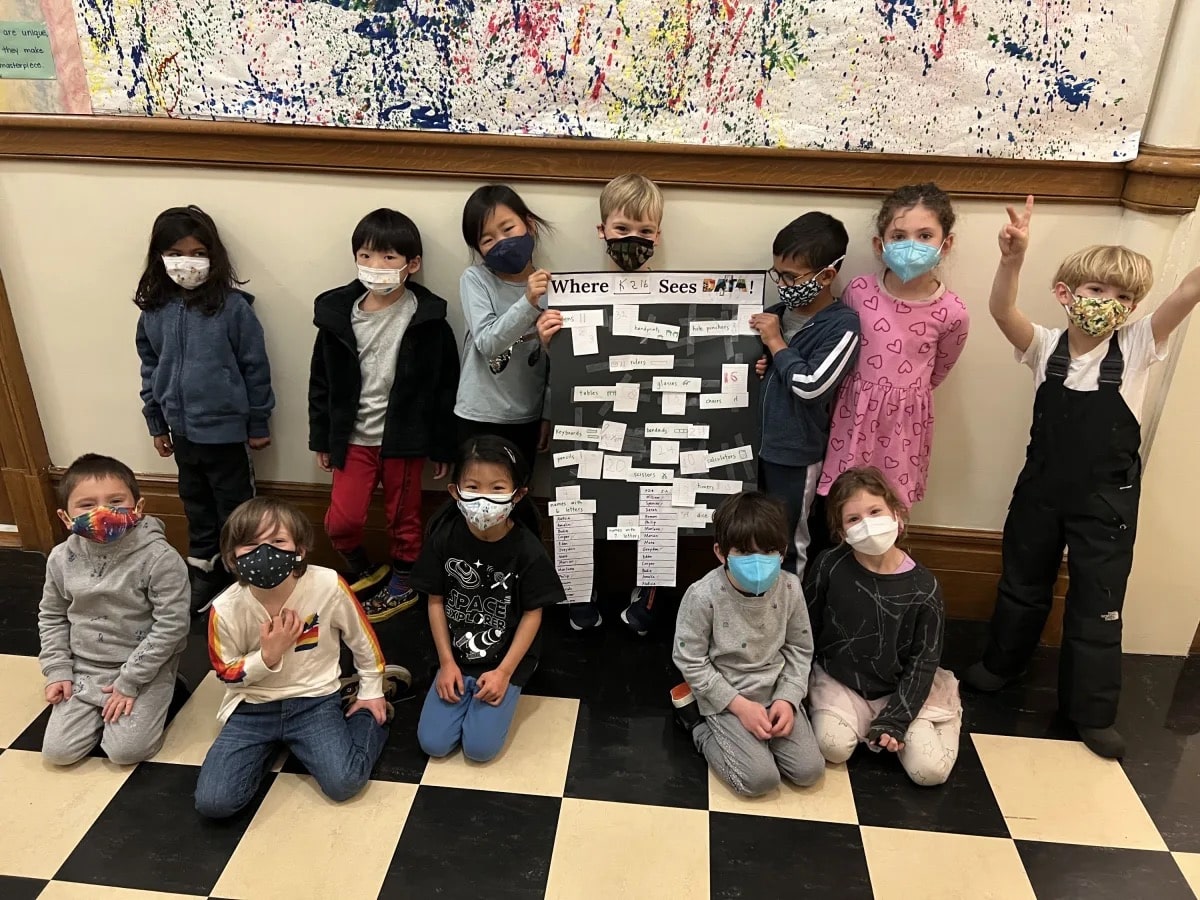
After a one-year hiatus, Data Day was back with a bang at Ethical Culture. “As the name suggests, the focus is on data, and throughout the day, students in all grades explore data in both their homerooms and specials classes,” says Ethical Culture Principal Rob Cousins.
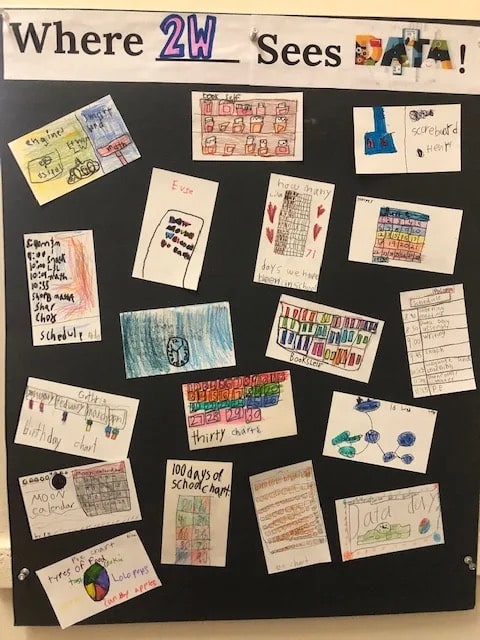
Students celebrated with posters they created, listing all the places they see data in the world around them.
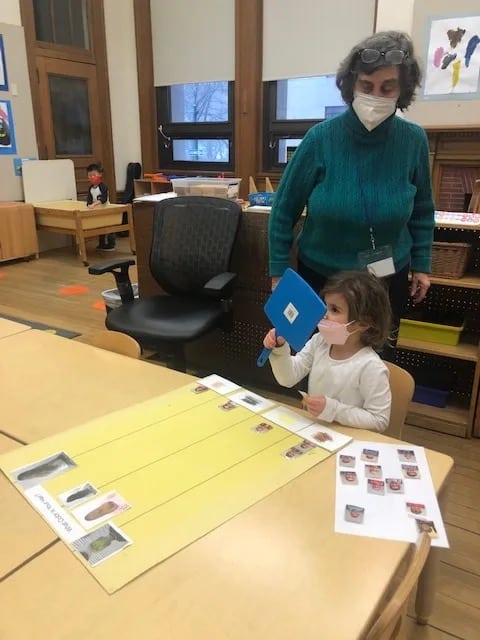
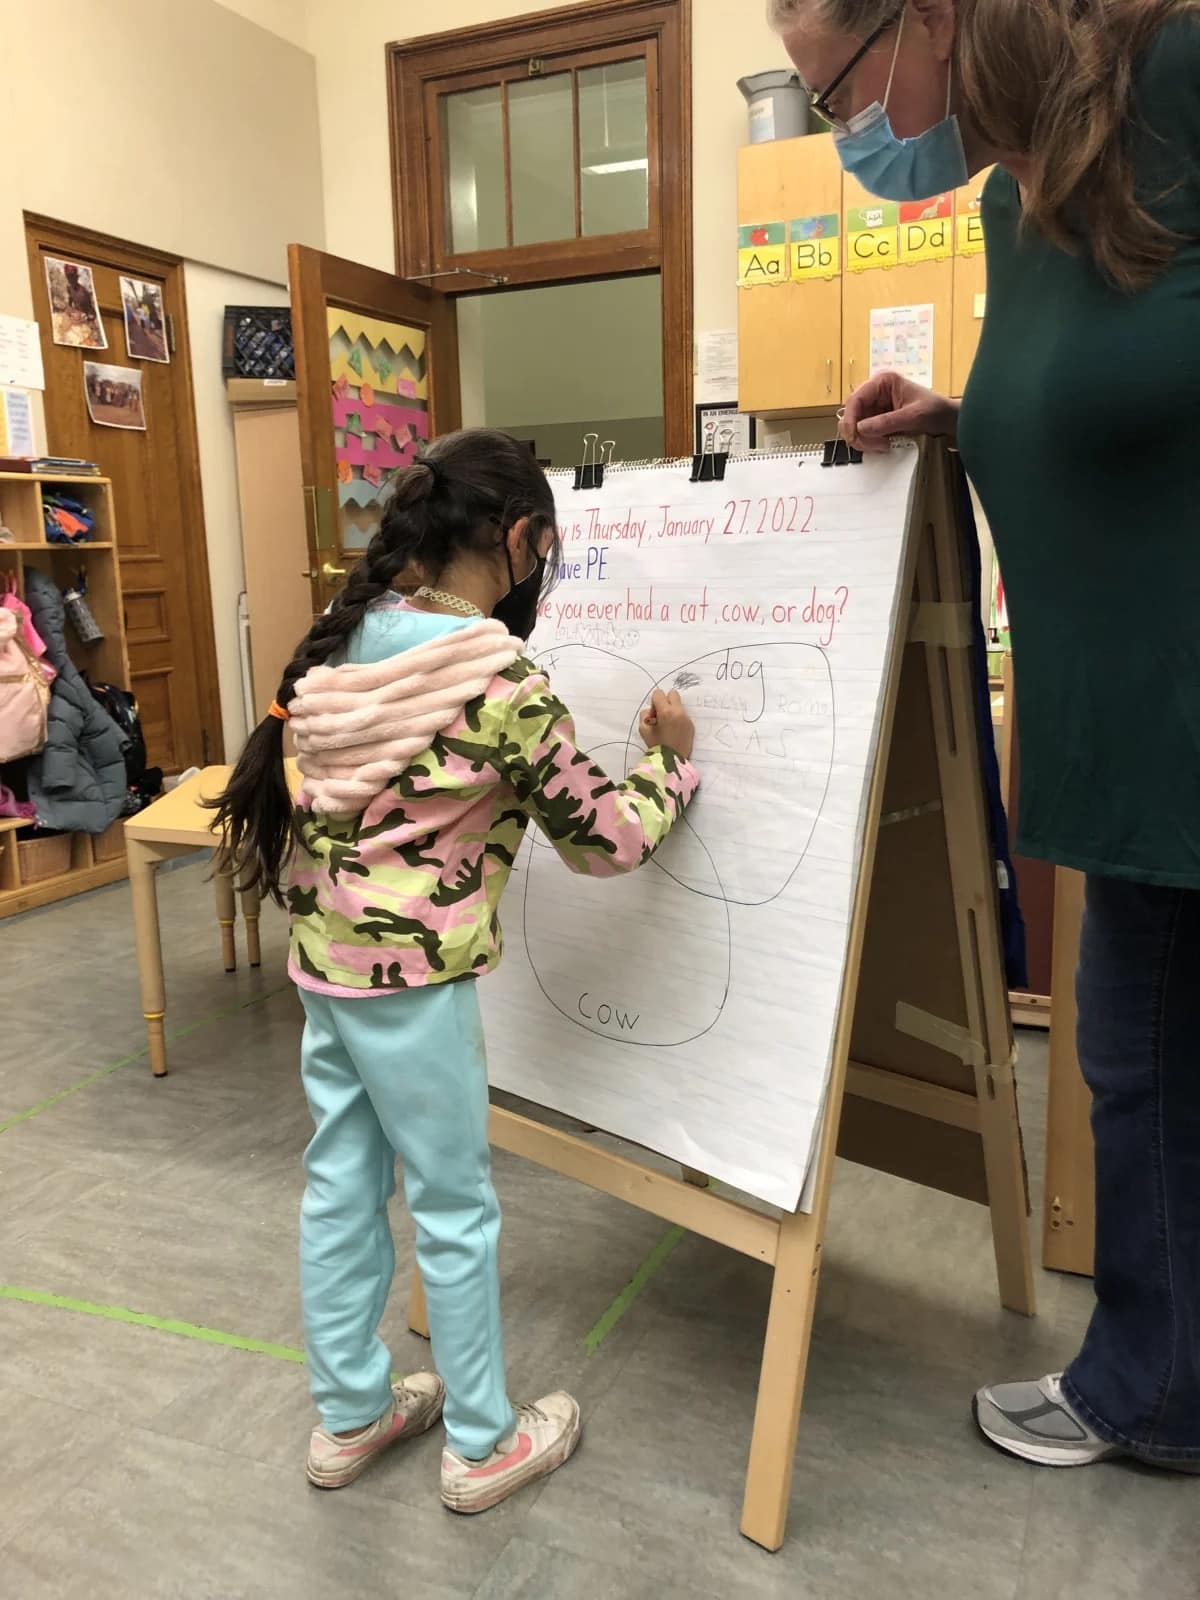
Karin Hoenig’s Pre-K class used data to answer the question, “what color is your hair?”
Kindergarteners in Betty Russell and Raz Robinson’s class put together data through surveys in their classroom. Kindergarten students also used data in their Spanish class with Teacher Cristina Ross.
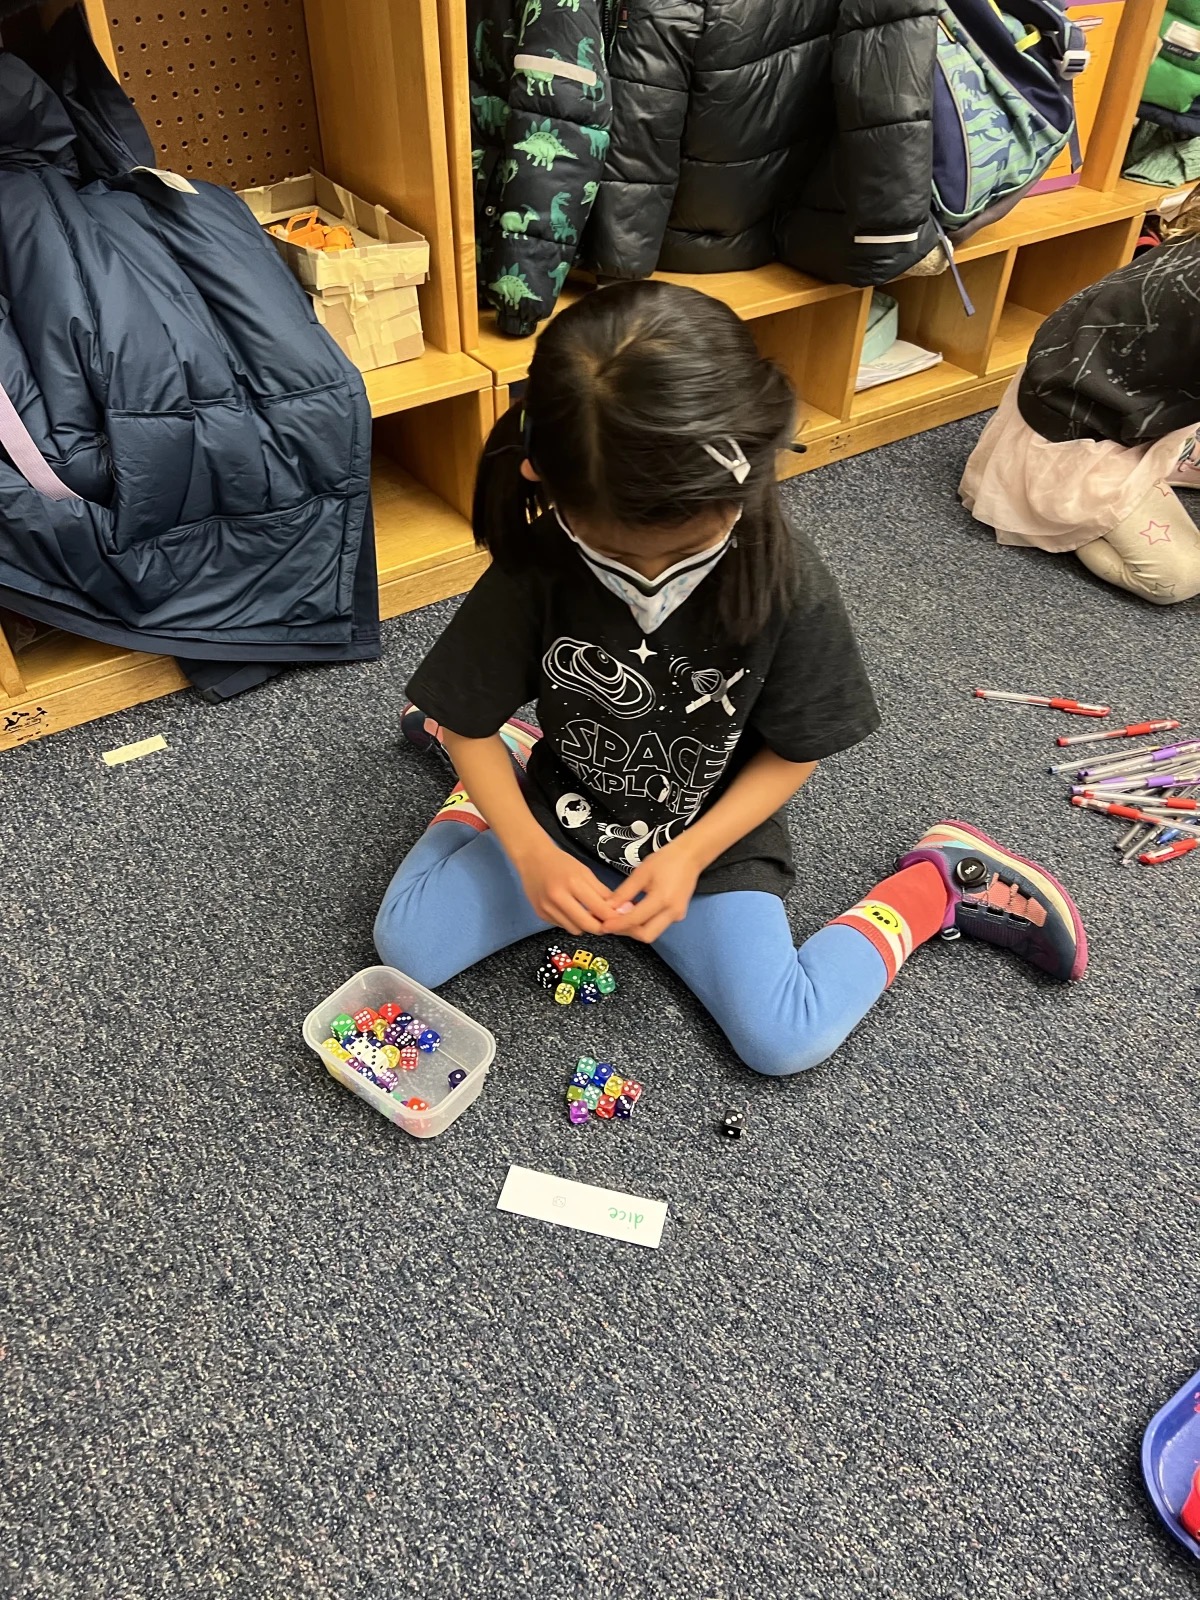
Maryann Mazzacaro and Catrina Fleischmann's Kindergarten class collected data by counting different materials around their classroom.
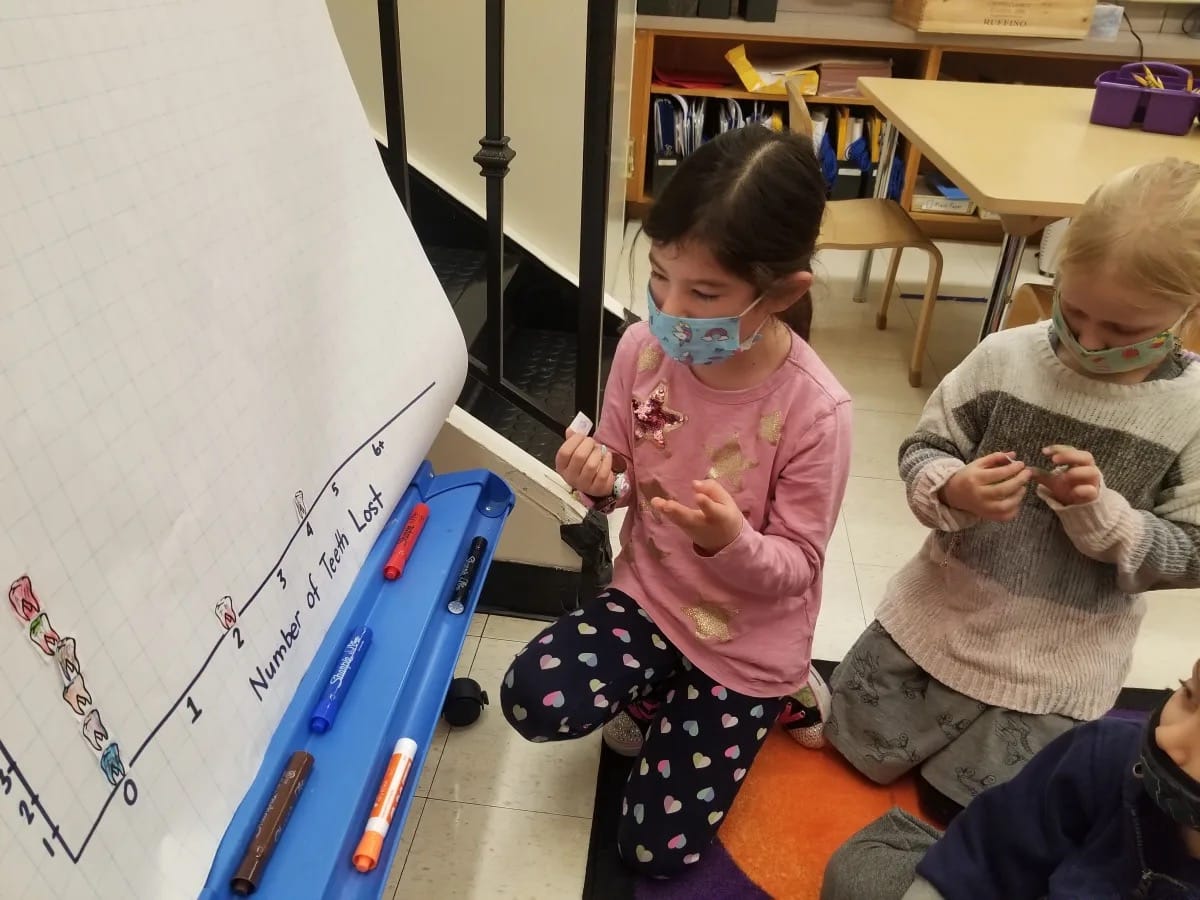
Kindergarten students are starting a unit in science about teeth and the digestive system. They labeled small tooth diagrams and used them to create a graph showing how many teeth they have lost.
1st Graders in Rosalinda Glennon and Justine Salata’s class started their day discussing data in their morning meeting.
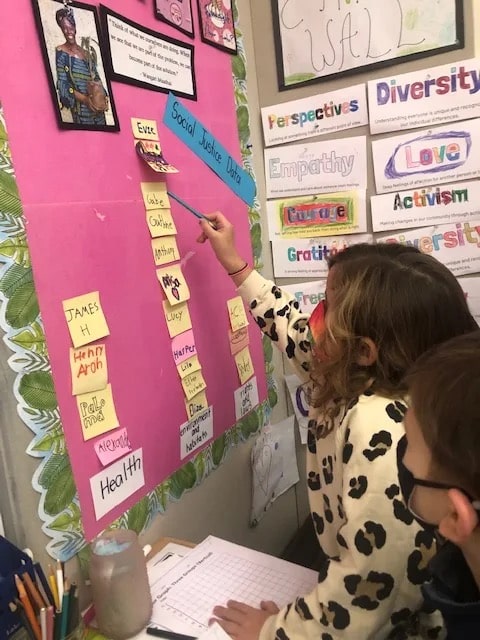
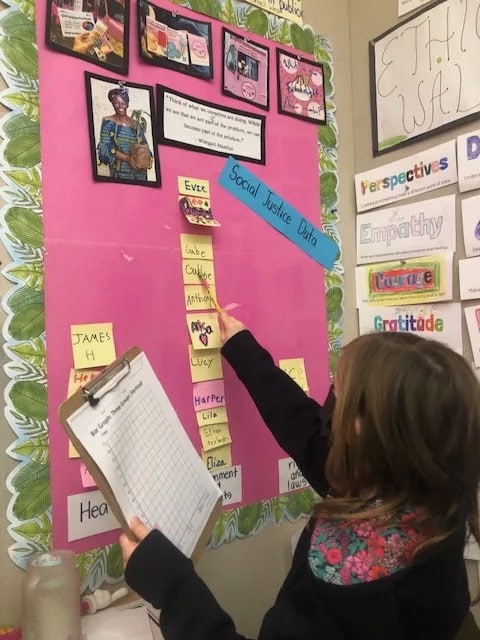
Blair Bizzell Hatcher and Ally Kaplan’s 2nd Grade class analyzed data with a social justice and activism lens.
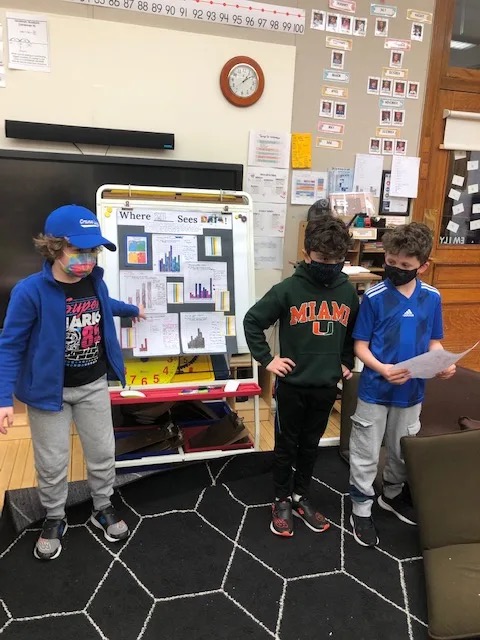
Similarly, Claudia Weber and Irene Jiang’s 2nd Grade class used data photos and bar graphs to represent findings and to make connections while studying social justice.
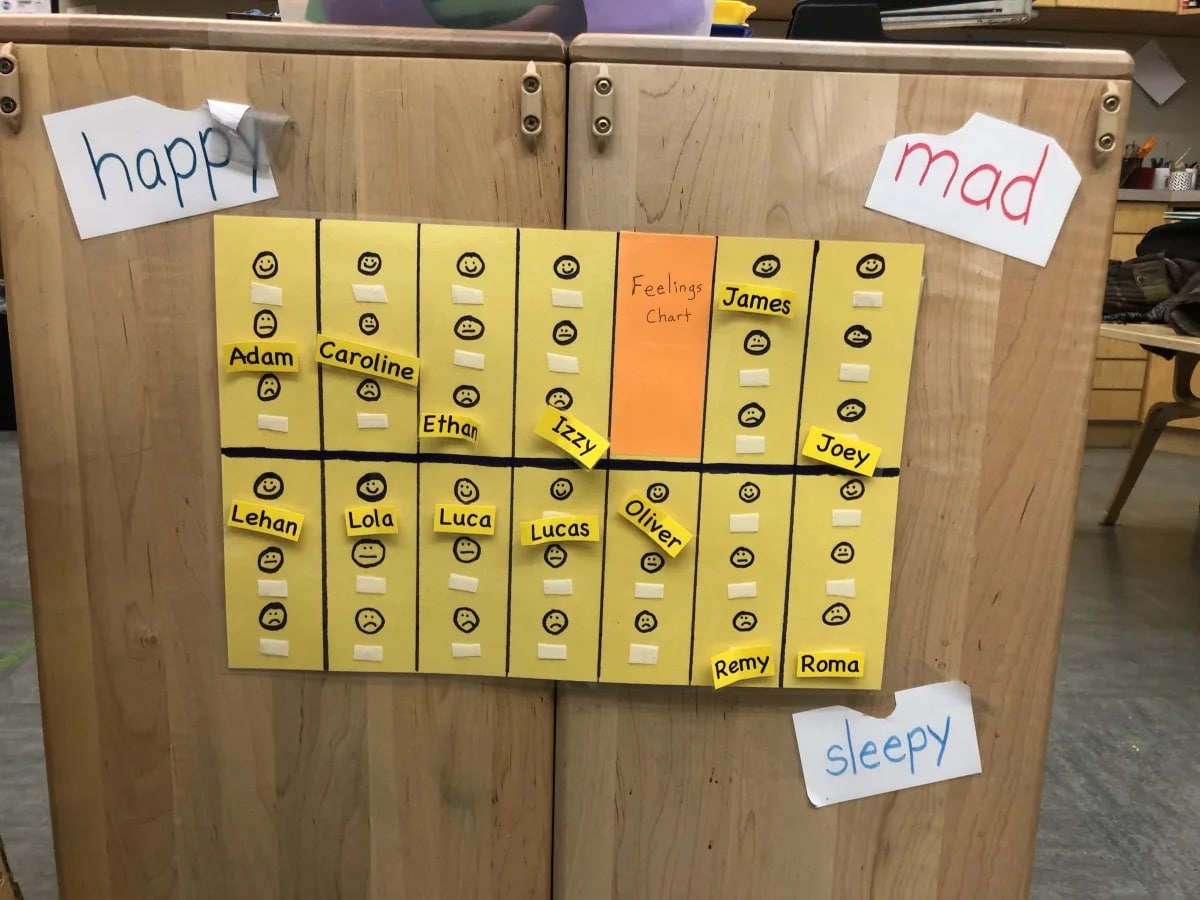
Radhika Hira and Emily Supron’s 2nd Grade class did a data analysis of a daily class mood meter chart from September through now. They analyzed the data and made bar graphs, then wrote scripts for a class movie to capture their learning process.
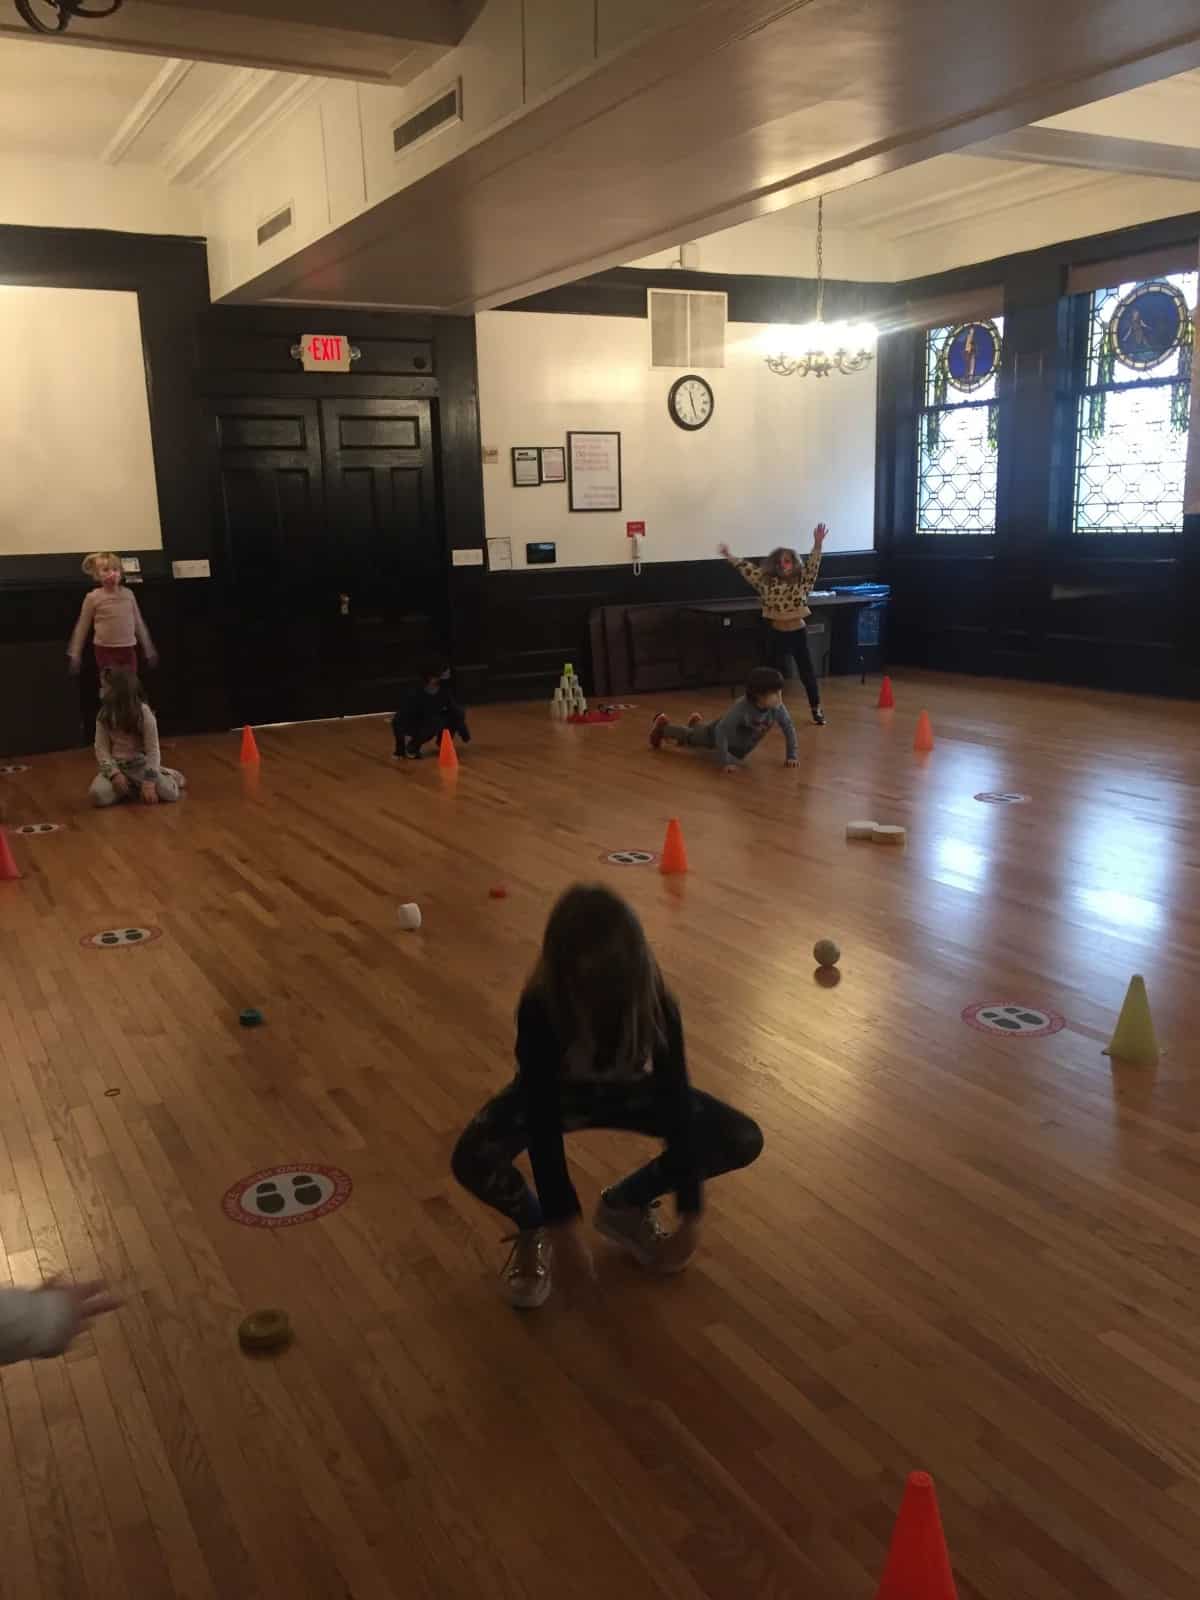
The P.E. classes also joined in to exercise their minds and bodies on Data Day. 3rd Graders did a combination of data pattern warm-ups; 3rd and 4th Graders also played a fun target game called fraction bowling. The 2nd Graders did warm-ups completing sets of 10 and 1st Graders did a similar warm up.
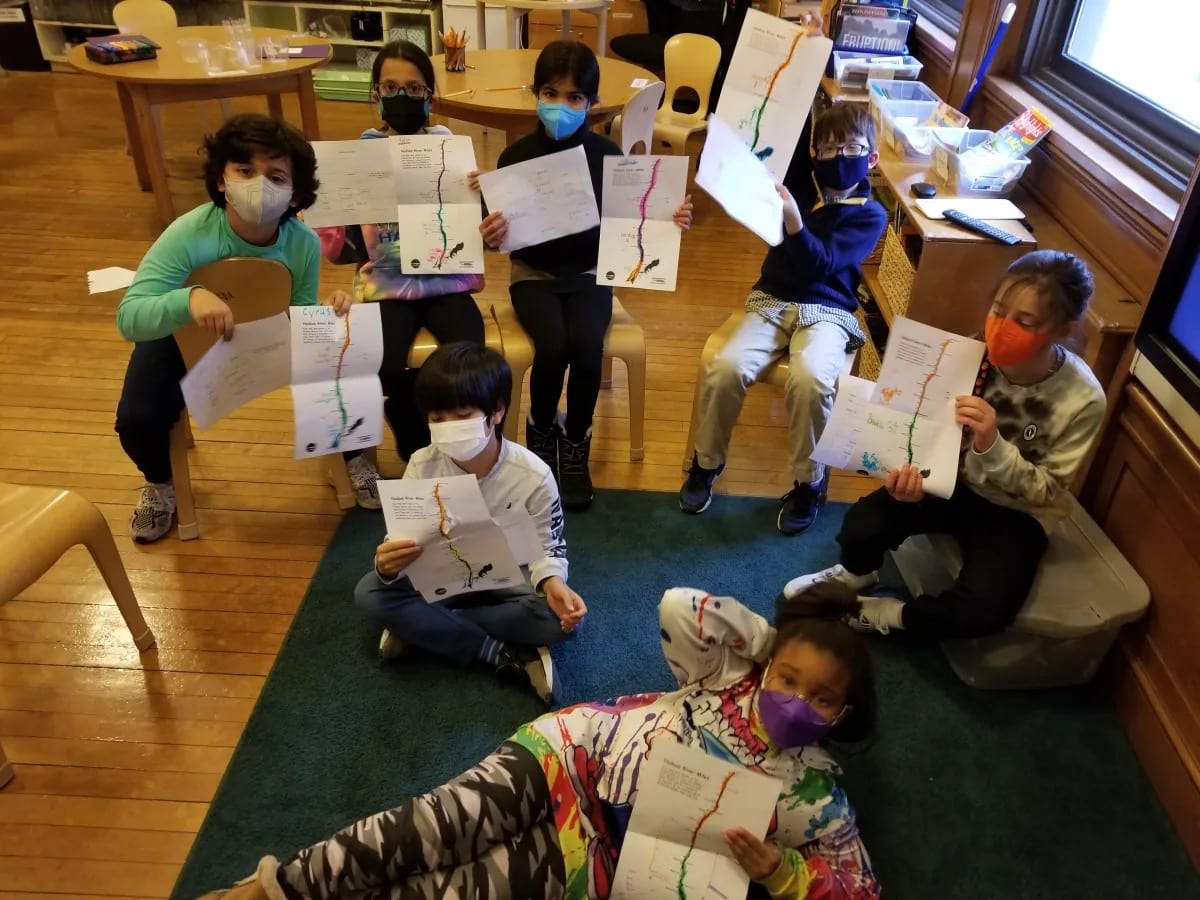
In 3rd Grade science, students collected data by conducting salinity tests for the three types of water found in the Hudson River. Then, they chartered their findings on a map of the Hudson River.
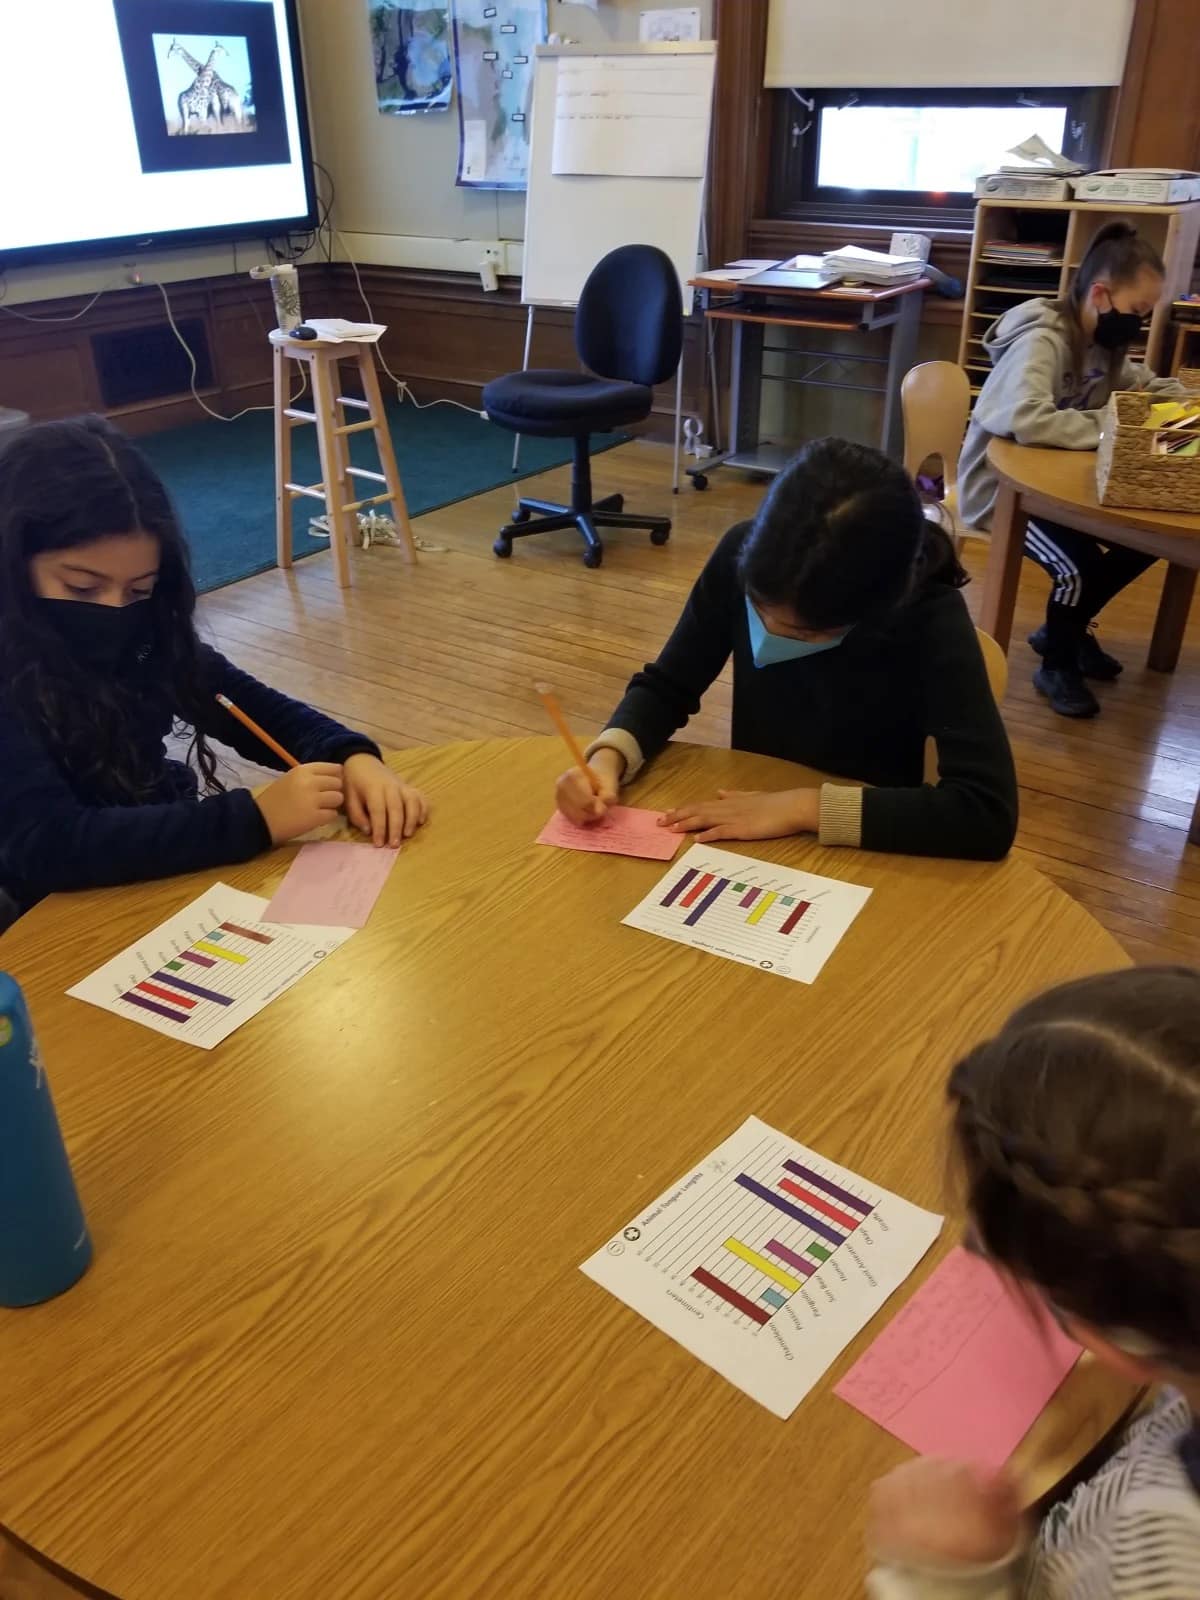
“In 3rd Grade math, students compared the tongue lengths of certain animals. Students wrote about what they learned from the graph, other animals they were curious about, and also compared lengths of the animals,” says Barbara Downing, Math Specialist and Science Teacher.
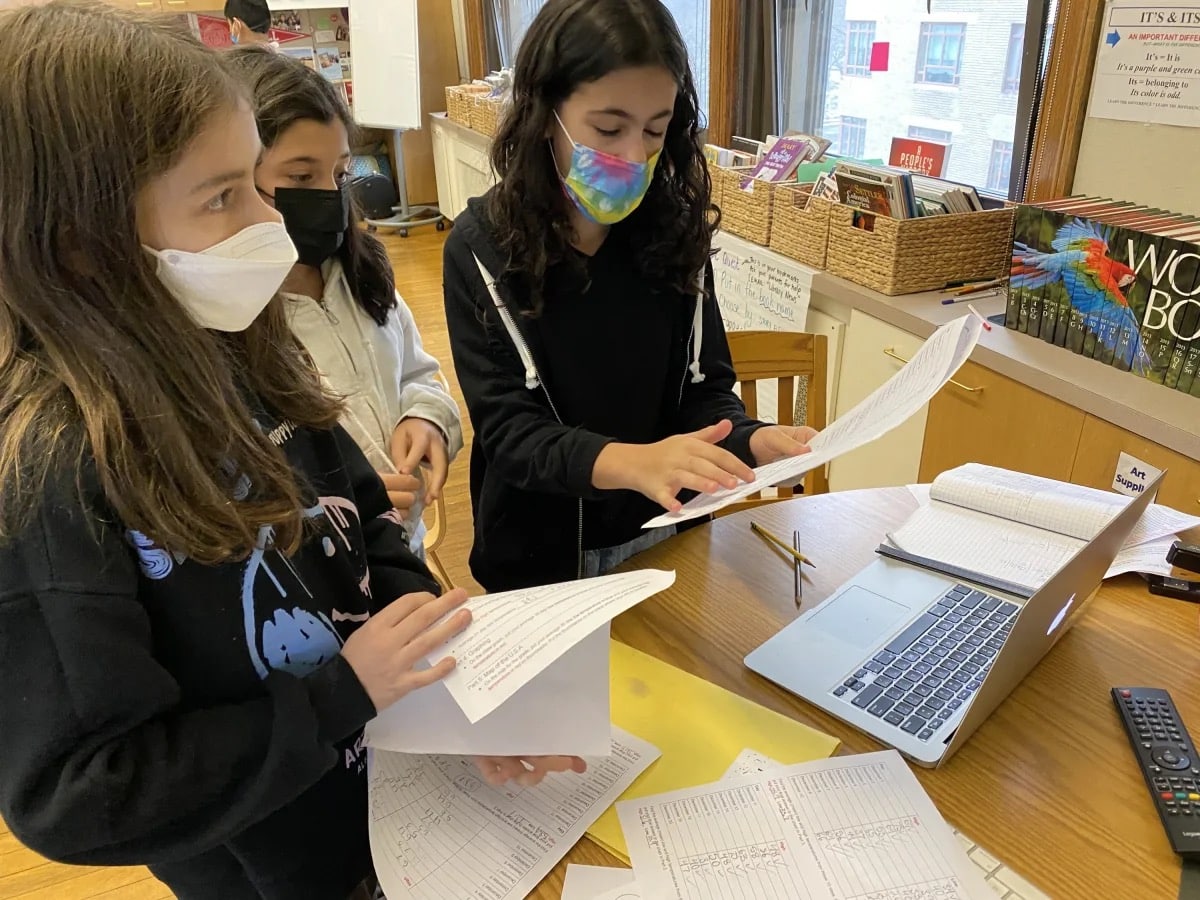
4th Graders worked with Math Specialist Jen Cooley to create their own survey questions to collect numerical data from their class as well as another class. After receiving the results, they analyzed and compared the data by creating a double line plot, identifying the mode, median, range, and outliers for their specific data question.
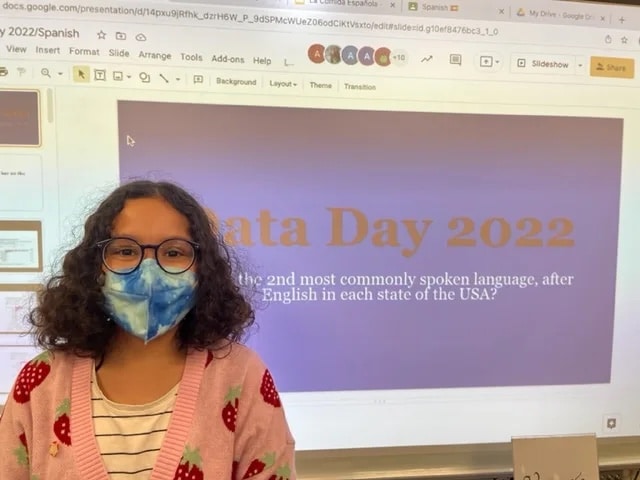
In Joan Singer’s Spanish classes, 4th Graders investigated which are the most frequently spoken languages in the United States.
Nelson Sanchez, Ethics Teacher, embedded data in ethical dilemma contexts for his 4th Grade classes.
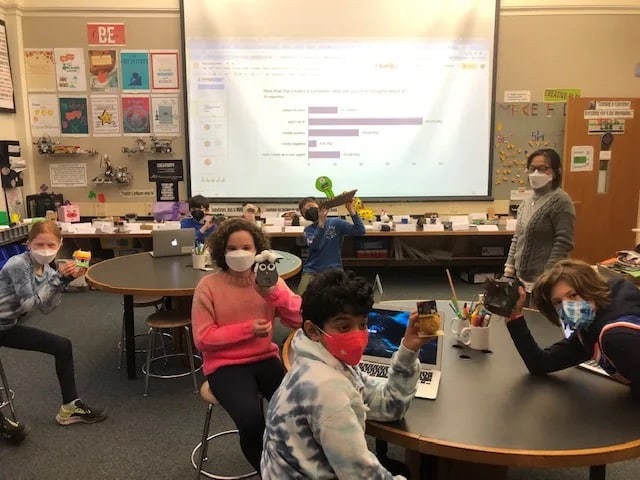
In Lan Heng’s computer classes, “The 5th Graders took a survey after their Micro:bit pet project to reflect and make inferences of their process! They analyzed the results and shared powerful and personal reflections,” according to Aerin Hong, Math Coordinator and Math Specialist.
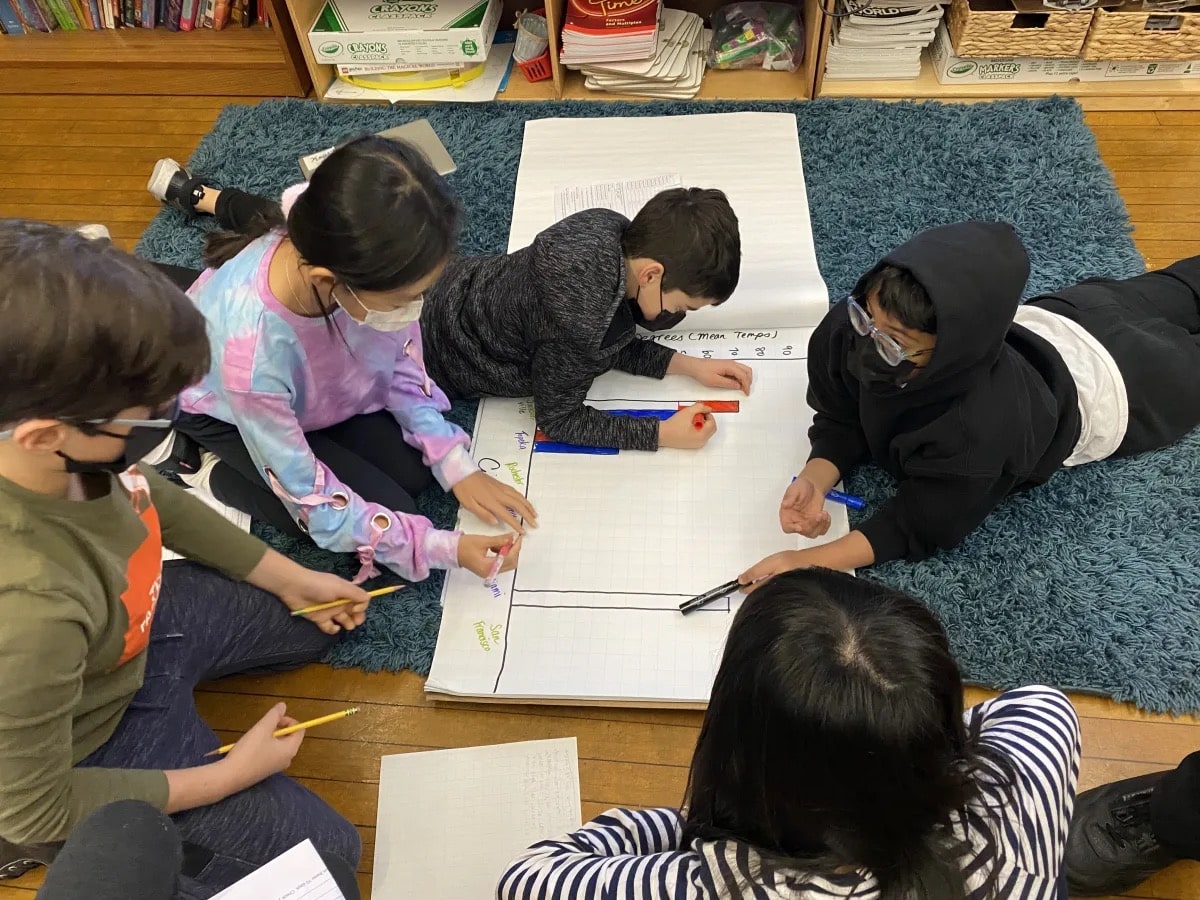
5th Graders in Kimberly Tan’s class graphed the mean high and low temperatures in various United States cities in December 2021.
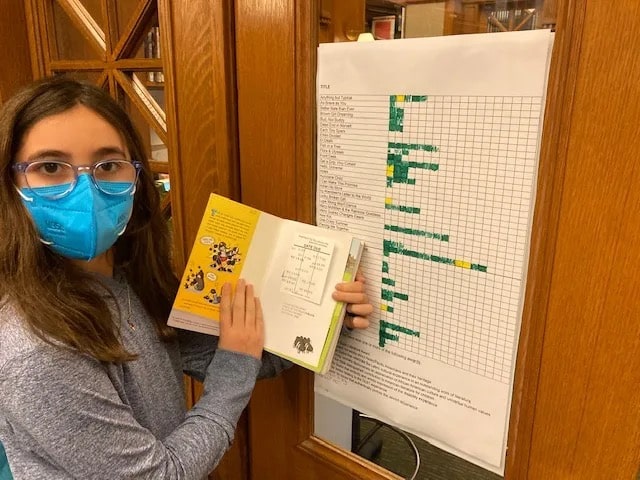
The library team worked with students to determine how many times a book has been taken out, how long has a book been in the library, and how many years has a book been circulating. Did you know the answers can be found on the due date slip in each book?